
Reason to trust

Strict editorial policy that focuses on accuracy, relevance, and impartiality
Created by industry experts and meticulously reviewed
The highest standards in reporting and publishing
Strict editorial policy that focuses on accuracy, relevance, and impartiality
Morbi pretium leo et nisl aliquam mollis. Quisque arcu lorem, ultricies quis pellentesque nec, ullamcorper eu odio.
In an update posted via X, veteran market analyst Peter Brandt shared a striking technical outlook for XRP/USDT, identifying a classic Head & Shoulders (H&S) formation in the daily chart that points to a possible retracement toward the $1.07 region.
Brandt’s chart tracks XRP daily bars from mid‐October through late March on Binance. The XRP surged from below $0.50 in late October to above $1.00 in mid‐November. After forming a bull flag, the asset continued aggressively higher, building a local top around $2.90 in early December before starting the last leg up as high as $3.40 in mid-January.
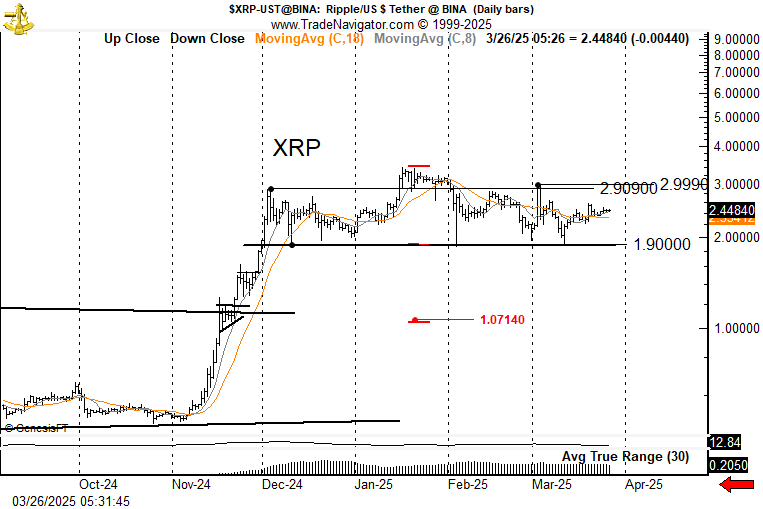
The 8‐day (C,8) and 18‐day (C,18) moving averages—shown in orange and black, respectively—now hover around the $2.44 mark, where the price is currently sitting.
XRP Could Crash If This Happens
Two notable horizontal levels frame the current trading zone. First is the $1.90 floor, which serves as the approximate neckline for the H&S pattern and has repeatedly acted as support. Second is the $2.90–$2.99 ceiling, a clear horizontal resistance band where XRP has struggled to sustain upward momentum.
Brandt states that a decisive break below $1.90 “would not be ideal for longs,” while any upside breach above $3.00 could force short sellers to reconsider their positions. On the chart, the left shoulder formed near the $2.90 handle, followed by a higher peak at $3.40, creating the “head.”
Subsequently, the right shoulder emerged closer to the $3.00 zone. The neckline sits around $1.90. If XRP breaks below that neckline with sufficient volume, Brandt’s measured‐move target suggests a decline to approximately $1.07. He labels this price objective with a red arrow, signaling the potential downside risk inherent in classical H&S patterns.
Brandt’s 8‐day and 18‐day moving averages converge around $2.44, indicating muted momentum at current levels. The 30‐day Average True Range (ATR) measures near $0.205, implying that daily price swings have compressed compared to the explosive action seen during XRP’s ascent from late 2024 through early 2025. Still, a break beyond $3.00 or below $1.90 could spark a renewed surge in volatility.
Brandt emphasizes his lack of a personal stake in XRP, explaining that he is merely relaying what he views as a “textbook” bearish pattern: “I have no vested interest up or down. XRP is forming a textbook H&S pattern. So, we are now range bound. Above $3.000 I would not want to be short. Be”low $1.9 I would not want to own it. H&S projects to $1.07. Don’t shoot the messenger.
At press time, XRP traded at $2.35.
Featured image created with DALL.E, chart from TradingView.com